Research Articles
Colombian Spanish design of the speech-in-noise discrimination test
Stage 1: Design of a contralateral and ipsilateral noise test and piloting in individuals with normal hearing
Laura Melisa Buitrago Roaa*  ,
Amanda Teresa Páez Pinilla , Eliana Romero Niño*
,
Amanda Teresa Páez Pinilla , Eliana Romero Niño*
Department of Human Comunicaction, Universidad Nacional de Colombia, Bogotá.
 OPEN ACCESS
PEER REVIEWED
ORIGINAL ARTICLE
Abstract
Context: Difficulty understanding speech in noise is a common symptom of auditory processing disorders that impairs communication and affects different age groups. Objective: To design a first version of a speech-in-noise discrimination test (DHR Test, in its Spanish acronym) with contralateral and ipsilateral noise and pilot the test in the normal-hearing Colombian population. Method: Descriptive study for test design and exploratory method for piloting. The pilot sample consisted of 10 men and 10 women aged 18-50 years without a neurotological history. For the statistical analysis, intelligibility of stimuli was measured and three interrelated categories were defined: Mode (contralateral or ipsilateral presentation of stimulus), Ear (left or right) and Noise (signal-noise ratio [SNR] of −5 dB and −10 dB). Results: The highest intelligibility was observed at −5 dB SNR, and stimuli were categorized as very easy; intelligibility at −10 dB SNR was 0.95 for words and 0.97 for sentences. The lowest intelligibility for words was 0.76 for the left ear, with ipsilateral noise at −10 dB SNR. Conclusions: According to our pilot test, the most suitable SNR is −10 dB. In the next stage of this test validation macroprocess, stimuli that were found to have very high or very low intelligibilities should be modified because they may hinder the interpretation of the test results.
Keywords
Auditory discrimination, auditory processing, speech-in-noise hearing test, diagnostic assessment, signal-to-noise ratio.
Clinical implications
The aim of sensitive speech audiometry techniques is to identify auditory processing disorders by means of speech discrimination tests. These tests may point to structural or functional lesions of the central auditory nervous system and the results can then be studied together with other paraclinical tests, such as diagnostic imaging or electrophysiological auditory tests. In terms of clinical implications, these tests not only help diagnose a lesion site, disorder or impaired auditory processing ability, but also provide a basis for deciding on an auditory intervention or rehabilitation programme to reduce disability and improve quality of life.
Received: 01.09.2022 Reviewed: 23.01.2023 Acepted: 16.03.2023 Published: 17.07.2023
Edited by:
Helia Relaño-Iborra
Technical University of Denmark.
Reviewed by:
Alicia Huarte Irujo
Universidad de Navarra.
Carlos Gejo Linia
Clínica Audiológica Audiored.
An annonymous reviewer
Introduction
The aim of a speech-in-noise discrimination test is to assess an individual’s auditory processing ability in discriminating words (speech) in a background noise (Wilson et al., 2007). People with normal peripheral hearing sensitivity may find it hard to discriminate speech in noise (Cañete, 2006). To date, there is no standard test in Colombia that is systematically used to specifically assess speech-in-noise discrimination that applies an ipsilateral and contralateral noise presentation mode. According to the most recent Health Situation Analysis (ASIS) on hearing and communication carried out by the Colombian Ministry of Health (MINSALUD et al., 2016), routine hearing tests only assess peripheral and vestibular hearing disorders, and do not cover auditory processing disorders (APDs).
Auditory processing includes skills such as sound localization and lateralization, auditory discrimination, auditory pattern processing, auditory temporal processing, and auditory performance in the presence of competing acoustic signals and degraded acoustic signals (Auditory Processing Disorders [APD], 2022). Speech-in-noise discrimination is an auditory processing skill that develops during auditory figure-ground neuromaturation (Ibáñez & Muro, 2015).
Speech-in-noise discrimination tests date back to the 1950s, when Ettore, Bocca and colleagues investigated the effects of temporal lobe tumours on speech perception. The authors first performed tests with word lists used in hearing tests, but these stimuli were less effective at finding disorders, and the redundancy of the spoken message had to be reduced (Geffner & Ross-Swain, 2019). Interest in learning how speech-in-noise discrimination is affected has led to the design of tests such as the Hearing-in-Noise Test (HINT; Nilsson et al., 1994), the Speech-in-Noise test (SIN; Killion & Villchur 1993), QuickSIN (Killion et al., 2004), the Words-In-Noise Test (WIN; Wilson et al., 2007) and the Bamford-Kowal-Bench Speech-in-Noise Test (BKB-SIN; Etymotic Research INC. 2005).
In Latin America, Spanish versions of mainstream tests have been developed, such that in Colombia, Páez (2001) designed a test battery for assessing dichotic auditory processing (BEPADI), with a subtest to assess sentence discrimination skill in the presence of competing contralateral noise using an SNR of 0 dB; in Chile, the Santiago auditory processing disorder test battery (SAPD) was created with four subtests, including a speech-in-noise discrimination test using an SNR of −10 dB and 0 dB with white noise and monosyllabic stimuli (Fuente & McPherson, 2006); and in 2008, Barón de Otero et al. adapted the hearing-in-noise test (HINT), whereby linguists and native speakers in 14 Latin American countries reviewed and classified 800 sentences, obtaining 287 final sentences after rejecting those that were very easy or very difficult and using an SNR of −7, −4 and −2 dB in contralateral mode.
Materials and methods
A quantitative paradigm was established for the study, with a descriptive method for test design and exploratory method for pilot stage. For the statistical analysis, we measured intelligibility, defined as the information from speech that is audible and usable for a listener (Hornsby, 2004). In practice, intelligibility refers to the proportion of participants’ correct responses to each spoken stimulus. If 100% of participants answer an item correctly, the intelligibility of that item is 100% or 1.0 if expressed as a ratio.
Three categories were established for the analysis. The first was Mode, which refers to the ipsilateral or contralateral presentation of the noise related to the signal of interest. The second was Noise intensity, which reflects the decibel level of the signal-noise ratio (SNR), which was −5 dB or −10 dB, considering that the words and sentences (stimulation signals) are presented 40 dB SL above the pure tone average (PTA) at frequencies of 500, 1000, 2000 and 3000 Hz in each ear, and the noise is presented at 45 or 50 dB SL above the PTA, which is equivalent to −5 dB or −10 dB above the intensity of the words and sentences to achieve an SNR of −5 dB or −10 dB. The third category was Ear, referring to whether the test ear was the left or right side.
Test design: verbal material
We reviewed noise types, acoustic characteristics and SNR intensities used in existing auditory discrimination tests. We also reviewed corpora of words and phonetically balanced sentences in Spanish, specifically, the Quirós and Morgante Corpus (Quirós & D'Elia, 1974) and the Sharvard Corpus (Aubanel et al., 2014). The purpose of reviewing these corpora was to create the verbal stimulus lists. First, we performed a phonetic transcription using “EasyPronunciation”, an online app (Baytukalov, date unknown). Then, we analysed each list phonetically and phonologically with the support of a linguist expert in experimental phonetics, who also assisted with the manual phonological transcription into Colombian Spanish, which helped inform methodological decisions.
We applied the following criteria when compiling the lists:
- Use of bisyllabic words with stress on the penultimate syllable
- Presence of Colombian Spanish phonemes
- Phonological distribution: each target phoneme in an attack position
- Use of the main syllabic structures
- Word frequency of use and regional familiarity, based on the 5,000 most-used words in the Spanish Royal Academy Corpus (CREA), version 3.0.
- Mean length of utterance (MLU): sentences with a mean utterance length less than or equal to 7 (MLU ≤ 7).
The Sharvard Corpus and the Quirós and Morgante Corpus both met the above criteria. The Sharvard Corpus is a collection of 700 sentences inspired by the Harvard Sentences, which is the original English version compiled by the Institute of Electrical and Electronics Engineers (IEEE) in 1965 for use in speech testing and research in fields such as acoustics and telecommunications (Institute of Electrical and Electronics Engineers, 1969). The Quirós and Morgante Corpus is widely used in hearing tests in five Spanish-speaking countries, including Argentina and Colombia, that has been standardized with 5,000 subjects and high intelligibility percentages in quiet and noisy environments (Quirós & D' Elia, 1974).
Test structure
The test was designed to assess word and sentence discrimination in each ear with competing ipsilateral or contralateral white noise, alternating between the ears to prevent fatigue from one side only. The average test time was 15 minutes. Each list of words and phonetically balanced sentences had 10 items. Figure 1 shows the order of presentation.
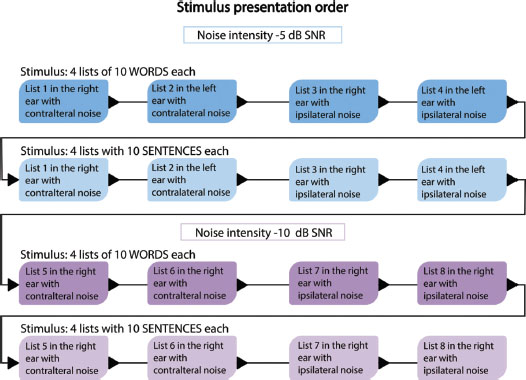
Figure 1. Stimulus presentation order.
Pilot test
The first pilot test in this project was exploratory and therefore it was conducted with a small sample and presented by reading out loud, since the items in the study design would change in the following stages to adjust to results obtained in this stage.
Participants
The sample consisted of 10 men and 10 women, recruited by non-probability convenience sampling, who voluntarily agreed to participate and signed an informed consent form. Inclusion criteria were age between 18 and 50 years, normal otoscopy and peripheral hearing sensitivity, with audiometric thresholds at all frequencies between −10 and 20 dB HL and no air-bone gap (see Table 1). The upper age limit of 50 years was established to monitor possible effects of auditory channel neurodegeneration. Exclusion criteria were chronic predisposing clinical conditions and/or an auditory, otological or neuropathological history.
Test application
To apply the test we used a calibrated two-channel audiometer and TDH 49 transducers under strict artificial conditions. The test was conducted with a female voice and the voltage of the examiner’s microphone was graduated. In addition, a printed form was used to mark correct and incorrect responses.
At the start of the test, participants were told to repeat each word or sentence they heard and that they would hear a noise at the same time, which they should ignore. Speech intensity was set at −5 dB and −10 dB SNR.
Table 1. Pure tone average (PTA) for each participant. F/M denotes female or male participant.
Participant |
Age (years) |
PTA right ear (dB HL) |
PTA left ear (dB HL) |
F1 |
43 |
5.00 |
3.75 |
F2 |
19 |
6.25 |
5.00 |
F3 |
30 |
6.25 |
5.00 |
F4 |
23 |
2.50 |
1.25 |
F5 |
23 |
8.75 |
1.25 |
F6 |
26 |
3.75 |
3.75 |
F7 |
25 |
−6.25 |
−1.25 |
F8 |
48 |
−1.25 |
−1.25 |
F9 |
22 |
3.75 |
−3.75 |
F10 |
23 |
1.25 |
6.25 |
M1 |
20 |
−3.75 |
−2.50 |
M2 |
20 |
0.00 |
−3.75 |
M3 |
20 |
1.25 |
1.25 |
M4 |
19 |
6.25 |
5.00 |
M5 |
45 |
1.25 |
1.25 |
M6 |
21 |
5.00 |
1.25 |
M7 |
22 |
5.00 |
2.50 |
M8 |
31 |
0.00 |
−5.00 |
M9 |
35 |
3.75 |
1.25 |
M10 |
20 |
11.25 |
11.25 |
Mean |
26.75 |
3.00 |
1.63 |
Standard deviation |
9.10 |
4.12 |
3.93 |
When scoring responses, each word was worth 10% and therefore at the end of each 10-word list, 100% was scored if all the words were repeated correctly. For the sentences, five keywords were highlighted and assessed in each sentence, due to their phonetic weight. Each word was worth 2% and therefore, if the sentence was repeated correctly, 10% was scored so that, by the end of a list of 10 sentences, 100% would be scored if they were all repeated correctly.
Results
Statistical analysis
For the statistical analysis of the results, we first performed a univariate analysis, considering the number of correct responses for each item. The score was calculated from correct repetitions of each individual word and, for the sentences, of each highlighted keyword. We then used a multivariate crossover design to combine the results of the variables of interest with a three-factor mixed design. We analysed interaction among Noise (in SNR), Ear tested, and Mode (ipsilateral or contralateral presentation of the noise) and investigated whether these factors caused significant differences in Intelligibility.
Table 2 shows an analysis of variance (ANOVA) for the specified design.
Table 2. Design of measures for WORDS and SENTENCES. Repeated measures ANOVA.
Design of measures for WORDS |
|||||||
|
DFn |
DFd |
SSn |
SSd |
F |
P |
p<.05 |
Mode of presentation of noise (ipsilateral or contralateral) |
1.00 |
19.00 |
0.58 |
0.19 |
57.90 |
0.00 |
* |
Ear tested (right or left) |
1.00 |
19.00 |
0.02 |
0.12 |
2.45 |
0.13 |
|
Noise intensity (−5 or −10 dB SNR) |
1.00 |
19.00 |
0.11 |
0.11 |
18.25 |
0.00 |
* |
Mode: Ear: |
1.00 |
19.00 |
0.05 |
0.16 |
5.97 |
0.02 |
* |
Mode: CL, IL noise |
1.00 |
19.00 |
0.07 |
0.16 |
8.70 |
0.01 |
* |
Ear: Noise |
1.00 |
19.00 |
0.04 |
0.12 |
6.54 |
0.02 |
* |
Mode: Ear: Noise |
1.00 |
19.00 |
0.06 |
0.11 |
9.40 |
0.01 |
* |
Design of measures for SENTENCES |
|||||||
Mode of presentation of noise (ipsilateral or contralateral) |
1.00 |
19.00 |
0.02 |
0.02 |
29.75 |
0.00 |
* |
Ear tested (right or left) |
1.00 |
19.00 |
0.00 |
0.01 |
4.59 |
0.05 |
* |
Noise intensity (−5 or −10 dB SNR) |
1.00 |
19.00 |
0.01 |
0.01 |
20.11 |
0.00 |
* |
Mode: Ear: |
1.00 |
19.00 |
0.00 |
0.01 |
0.66 |
0.43 |
|
Mode: Noise |
1.00 |
19.00 |
0.01 |
0.02 |
14.64 |
0.00 |
* |
Ear: Noise |
1.00 |
19.00 |
0.00 |
0.01 |
1.58 |
0.22 |
|
Mode: Ear: Noise |
1.00 |
19.00 |
0.00 |
0.01 |
2.70 |
0.12 |
|
DFn: Degrees of Freedom in the numerator, DFd: Degrees of Freedom in the denominator, SSn: Sum of Squares in the numerator (SS effect), SSd: um of Squares in the denominator (SS error), F: F-value, p: p-value (probability of the data given the null hypothesis). p <0.05: highlights p-values less than the traditional alpha level of 0.05. |
|||||||
According to Table 2, in the case of words, the interaction among Mode, Ear and Noise was significant. This implies that, regardless of the individual intelligibility value for each variable, the response varied according to the interaction among the three variables. As expected, we found a difference between ipsilateral and contralateral Mode of presentation, especially in ipsilateral mode for the left ear (see Figure 2). We plan to compare this finding in future pilot tests in participants with different types of hearing loss.
The statistics for Intelligibility of words dependent on Noise, Ear and Mode are summarized in Figure 2. Comparing noise Mode, we found that the presence of ipsilateral noise reduced intelligibility. In almost all cases, words had higher intelligibility in the left ear, except when the stimulus was heard at −10 dB SNR with ipsilateral noise. Intelligibility was significantly lower when these variables were combined.
The same ANOVA analysis was performed for the sentences test (see Table 2). We found no significant interactions involving the variable Ear, although the variable itself was significant. This means that the ear where the signal was received influenced intelligibility, but that ipsilateral or contralateral noise when listening with the right ear was not significant, because they were statistically equal. However, interaction between Mode and Noise was significant, and Mode differed depending on the level at which the noise was heard, emphasizing the importance of testing with both ipsilateral and contralateral noise.
In the case of the sentences test, shown in Table 2, the difference between ipsilateral and contralateral noise was higher when the noise level was −10 dB SNR. Ipsilateral noise again resulted in lower intelligibility. The right ear was found to have higher sentence intelligibility, except when the sentence was listened to with ipsilateral noise at −10 dB SNR, in which case the intelligibility percentage was higher with the left ear. Finally, comparing the right and left ear panels, listening with noise at −10 dB SNR resulted in lower intelligibility.
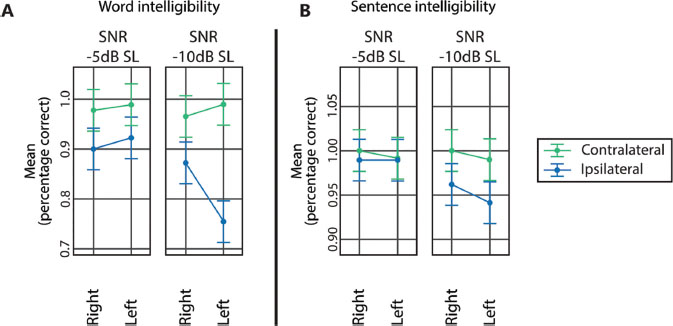
Figure 2. Intelligibility of WORDS and SENTENCES.
In addition, we calculated mean intelligibility for −5 dB and −10 dB SNR, for both words and sentences alike. Listening to the words with −5 dB and −10 dB SNR resulted in a mean intelligibility of 0.90 and 0.95, respectively. Listening to the sentences with −5 dB and −10 dB SNR resulted in a mean intelligibility of 0.99 and 0.97, respectively, which was higher than in the case of listening to the words.
Finally, we performed a k-means cluster analysis to classify the words and sentences according to their difficulty, set by level of intelligibility. In all cases, difficulty was very low with −5 dB SNR, which would have hindered the analysis because most stimuli would be classified as very easy. In view of the above, Table 3 shows stimuli with −10 dB SNR only, where the mean of correct responses (intelligibility) is shown for each group of stimuli.
Table 3. Groups of WORDS and SENTENCES, by difficulty presented with an SNR of −10 dB.
Group |
1 |
2 |
3 |
4 |
5 |
Mean of (Intelligibility) |
0.536 |
0.725 |
0.836 |
0.938 |
1 |
Mean of sentences (Intelligibility) |
0.810 |
0.903 |
0.943 |
0.960 |
0.985 |
Difficulty |
Very difficult |
Difficult |
Normal |
Easy |
Very easy |
Discussion
The results suggest that with an SNR of −5 dB, stimuli are perceived as very easy, because participants with normal hearing obtained very high intelligibility scores for both words and sentences. Compared with findings using the QuickSIN test method (Killion et al., 2004), where decibels are changed in steps of 5 dB SNR to find the listener’s ability level, it can be inferred that, in this case, using −5 dB SNR would be particularly useful to detect only individuals with severely impaired hearing because those with normal hearing perceive the stimuli very easily.
The SNR of −10 dB resulted in lower intelligibility levels, with a mean of 0.95 and 0.97 for words and sentences, respectively. Our result corroborates the findings of the Santiago auditory processing disorder test battery (SAPD), where SNRs of −10 dB and 0 dB were used for speech discrimination tests (Fuente & McPherson, 2006). In addition, according to the results of the cluster analysis of an SNR of −10 dB, when grouping stimuli by difficulty or intelligibility level, the words or sentences in the groups that had outlying scores (very easy or very difficult) must be investigated, because it is these two groups, mainly, that pose the biggest challenges when interpreting the results.
When we analysed the linguistic characteristics of the words and sentences classified as very easy or very difficult, we found that these extremes could be due to two factors: one, degree of regional familiarity with words and two, grammatical construction of the sentences, since compound sentences may be harder to perceive than simple sentences. We were unable to take grammatical complexity of sentences into account when creating the sentence lists in this study because the Sharvard Corpus (Aubanel et al., 2014) contains both simple and compound sentences, and modifying these lists would have altered the phonetic balance of each sentence.
Other aspects to investigate, which could explain the easy and difficult extremes, are Mode, Noise and Ear, because we observed interesting findings such as the fact that the two words and the one sentence classified as very difficult were perceived in the left ear with ipsilateral noise at −10 dB SNR, and, on the contrary, the words and sentences classified in the very easy group were distributed across all possible combinations of Mode, Ear and Noise. This common pattern found for both words and sentences that were classified as very difficult may be explained by the greater anatomical and functional complexity of the left auditory pathway, which has a double-crossing path towards the left dominant hemisphere for language functions (Katz, 1994). This also explains why ipsilateral noise presentation is likely to be harder, since less auditory information is conveyed up the ipsilateral path compared to the contralateral path.
The type of noise used for these tests varies by author. Seonǵ et al., (2009) recommended speech noise, the SIN, BKB SIN and QuickSIN tests use babble noise (Etymotic Research INC, 2001) and the Santiago auditory processing disorder test battery uses white noise (Fuente & McPherson, 2006). We decided to use white noise in this study because we made several attempts during piloting using −5 dB SNR and −10 dB SNR with ipsilateral speech noise and we found that the signal was masked. Even at an easier SNR of −2 dB, discrimination was hard for participants with normal hearing. However, since the background noise applied did not include speech stimuli, the results obtained are valid for these artificial pilot conditions but cannot be extrapolated to normal daily situations, such as conditions when listening to speech-shaped background noise.
Conclusions
The speech-in-noise test can be applied using all the possible established combinations of Mode, Ear and Noise, since each analysis yielded discrete clinical data on auditory processing and discrimination ability. The three categories interact, causing variation in the intelligibility levels of words and sentences. In addition, the stimuli with lower intelligibilities (very difficult) were observed in the left ear with ipsilateral noise, which confirms the greater anatomical and functional complexity of the left auditory pathway. However, if applied only in individuals with different types of hearing loss and clinical conditions, it will be possible to evaluate whether it is important to differentiate between contralateral and ipsilateral presentation of noise.
Stimuli with very high or very low intelligibilities should be modified because they may hinder the interpretation of the test results. Finally, it can be concluded that −10 dB is the most suitable SNR to use in the next stage of this test validation macroprocess, while the intelligibility levels of the stimuli suggest that the test may be applicable in individuals with normal hearing. However, these results are preliminary because this is the first stage in the test validation macroprocess.
References
Aubanel, V., Garcia Lecumberri, M. L., & Cooke, M. (2014). The Sharvard Corpus: A phonemically-balanced Spanish sentence resource for audiology. International Journal of Audiology, 53(9), 633–638. 10.3109/14992027.2014.907507
Auditory processing disorder (APD). The American Academy of Audiology. (2022, February 9). Retrieved August 16, 2022, from https://www.audiology.org/practice-resources/coding/coding-frequently-asked-questions/auditory-processing-disorder-apd/
Barón de Otero, C., Brik, G., Flores, L., Ortiz, S., & Abdala, C. (2008). The Latin American Spanish Hearing in Noise Test. International Journal of Audiology, 47(6), 362–363. doi:10.1080/14992020802060888
Baytukalov, T. (s/f). Spanish pronunciation tool - IPA phonetic transcription. Easypronunciation.com. Retrieved on November 20, 2021 from: https://easypronunciation.com/en/spanish-phonetic-transcription-converter
Cañete S, O. (2006). Desorden del procesamiento auditivo central (DPAC). Revista de otorrinolaringología y cirugía de cabeza y cuello, (66), 263–273.
Etymotic Research INC. (2001). QuickSIN Speech in Noise test. https://manualzz.com/doc/6926774/etymotic-quicksin-speech-in-noise-test-user-manual
Etymotic Research INC. (2005). BKB SIN user Manual. Retrieved in November 2021 from https://manualzz.com/manual/Etymotic/BKB-SIN%20Speech-in-Noise%20Test/
Fuente, A., & McPherson, B. (2006). Auditory processing tests for Spanish-speaking adults: An initial study. International Journal of Audiology, 45(11), 645–659. doi:10.1080/14992020600937238
Geffner, D., & Ross-Swain, D. (2019). Auditory Processing Disorders: Assessment, Management, and Treatment. Plural Publishing Inc.
Hornsby, B. (2004) El índice de inteligibilidad del habla: ¿Qué es y para qué sirve? The Hearing Journal 57(10):p 10–17.
Ibáñez Martínez, M. J., & Muro Jiménez, M. B. (2015, marzo). Estimulación de la vía auditiva: materiales. Revista nacional e internacional de educación inclusiva, 8(1), 134–147.
Institute of Electrical and Electronics Engineers. (1969). IEEE recommended practice for speech quality measurements. IEEE Transactions on Audio and Electroacoustics, 17(3), 225–246.
Katz, J. (1994). Handbook of Clinical Audiology. Williams/Wilkins. Fourth Edition. 14, 197 – 208.
Killion, M. C., Niquette, P. A., Gudmundsen, G. L Revit LJ & Banerjee S. (2004, October). Development of a quick speech-in-noise test for measuring signal-to-noise ratio loss in normal-hearing and hearing-impaired listeners. J. Acoust. Soc. Am., 116(4), 2395–2040.
Killion, M. C., and Villchur, E. (1993). "Kessler Was Right-Partly: But SIN Test Shows Some Aids Improve Hearing in Noise," Hear. J. 46(9), 31–35.
MINSALUD, Organización Panamericana de Salud, & Organización Mundial de la Salud. (2016). ANÁLISIS DE SITUACIÓN DE LA SALUD AUDITIVA Y COMUNICATIVA EN COLOMBIA Convenio 519 de 2015.
Nilsson, M., Soli, S. D., & Sullivan, J. A. (1994). Development of the Hearing In Noise Test for the measurement of speech reception thresholds in quiet and in noise. The Journal of the Acoustical Society of America, 95(2), 1085. 10.1121/1.408469
Páez, A. (2001). Diseño y validación de la batería de evaluación del procesamiento auditivo dicótico (BEPADI) en sujetos sin antecedentes Neuro- otológicos. AUDIOLOGIA HOY. Asoaudio, ISSN 1657-723X (1), 17–22.
Quirós, J. B., & D'Elia, E. N. (1974). La audiometría del adulto y del niño. Ed. Paidós.
Real Academia española (s/f) Banco de datos (CREA) [versión 3.0 en línea]. Corpus de referencia del español actual. Retrieved on September 10, 2021 from: <http://www.rae.es>
Seonǵ, H. L., Hyun, J. S., Sang, W. Y., & Kyoung, W. L. (2009). Effects of Various Background Noises on Speech Intelligibility of Normal Hearing Subjects. Korean Journal of Otolaryngology-Head and Neck Surgery, 52(4), 307–311. 10.3342/kjorl-hns.2009.52.4.307
Wilson, R. H., McArdle, R. A., & Smith, S. L. (2007). An Evaluation of the BKB-SIN, HINT, QuickSIN, and WIN Materials on Listeners With NormalHearing and Listeners With Hearing Loss. Journal of Speech, Language, and Hearing Research, 50(4), 844–856. 10.1044/1092-4388(2007/059).
Conflict of interest
The authors declare no conflict of interest.
Author contributions
* Equal contribution
Laura Buitrago and Eliana Romero: data storage and analysis, conception, research, methodology, resources, visualization, creation, writing, drafting and editing of the paper.
Amanda Páez: conception, research, methodology, resources, project management, supervision, original draft and editing of the paper.
How to cite:
Buitrago Roa, L.M., Páez Pinilla, A. T. & Romero Niño, E. (2023).
Colombian Spanish design of the speech-in-noise discrimination test. Stage 1: Design of a contralateral and ipsilateral noise test and piloting in individuals with normal hearing. Auditio, 7.
https://doi.org/10.51445/sja.auditio.vol7.2023.0088
Correspondence
aLaura Melisa Buitrago Roa.
Departamento de Comunicación Humana,
Universidad Nacional de Colombia.
Email: lambuitragoro@unal.edu.co
Editorial Office
Copyeditor: Tomás Pérez Pazos
Translation: Emma Goldsmith
Trans. Revision: Helia Relaño-Iborra
Production: Glaux Publicaciones Académicas