Research Articles
Reliability and Validity of the Auditory Brainstem Response
Franz Zenker* , José Juan Barajas de Prat
Barajas Clinic, Santa Cruz de Tenerife, Spain
 OPEN ACCESS
PEER REVIEWED
ORIGINAL ARTICLE
DOI: 10.51445/sja.auditio.vol9.2025.114
Received: 21.02.2025
Reviewed: 10.03.2025
Accepted: 24.06.2025
Published: 22.10.2025
Edited by:
Gerard Encina-Llamas
Facultat de Medicina. Universitat de Vic - Universitat Central de Catalunya (UVic-UCC) / Copenhagen Hearing and Balance Center (CHBC) - Rigshospitalet (Dinamarca).
Reviewed by:
Miguel Temboury-Gutiérrez
Hearing Systems section. Department of Health Technology. Technical University of Denmark (DTU).
Lídia Roig Canales
Hospital Universitari Sant Joan de Déu, Barcelona.
Vicente Curcio
Universidad del Museo Social Argentino (UMSA), Argentina.
How to cite:
Zenker, F. and Barajas de Prat, J.J. (2025). Reliability and Validity of the Auditory Brainstem Response. Auditio, 9, e114. https://doi.org/10.51445/sja.auditio.vol9.2025.114
Correspondence
*Franz Zenker
Calle, Pérez de Rozas 8, 38004 Santa Cruz de Tenerife, Canary Islands, Spain.
Email: zenker@clinicabarajas.com
 CC-BY 4.0
© 2025 Los autores / The authors
https://journal.auditio.com/
Publicación de la Asociacion Española de Audiología (AEDA)
Abstract
Electrophysiological recordings allow the evaluation of the functional integrity of the peripheral and central auditory structures. Among them, the Auditory Brainstem Responses (ABR) are a fundamental tool for the study of the neurophysiology of the auditory pathways. Due to the low amplitude and the unavoidable noise contamination, both biological and external, the use of procedures that improve the quality and definition of the recordings obtained is required.
This study aims to evaluate ABR’s reliability and validity. Reliability is analyzed through the Standard Deviation Ratio (SDR); and the Correlation Coefficient between Replicates (CCR); which allow for assessing the consistency and reproducibility of the responses. Weighted averaging improves the signal-to-noise ratio (SNR) and reduces the time required for electrophysiological evaluation.
Convergent validity evaluates the correlation between electrophysiological and behavioral tests when measuring the same construct, in this case, auditory perception. Criterion validity determines the scale in which a test correlates with an external reference variable, such as the degree of hearing loss or the clinical diagnosis of hearing loss. Different statistical procedures arise to establish the auditory thresholds through the ABRs. It’s postulated that, in order to estimate the auditory thresholds through ABRs, each institute must establish its own control group. Additionally, the most commonly used procedures are analyzed to improve the correlation between ABRs and behavioral responses.
Keywords
Auditory Brainstem Response, reliability, validity, sensitivity, specificity.
Clinical Implications
The precision of Auditory Brainstem Responses depends on factors such as the signal to noise ratio, the stability of the neurophysiological response, the intra-observer and inter-observer variability, and the biological variability. For a quality evaluation of the recordings, statistical estimates are used, which allow for a quantification of the sources of variability. Techniques such as weighted average improve reliability and reduce the time required for the test. In addition, the precision increases when each institution establishes models between physiological and behavioral tests, guaranteeing consistent and reproducible estimations of the auditory thresholds. This precision improvement allows for a more trustworthy characterization of auditory sensitivity, which facilitates the diagnosis and the appropriate selection of intervention strategies, especially with less cooperative patients.
Introduction
In clinical practice, diverse methods are used to evaluate auditory function, ranging from behavioral procedures, such as pure-tone audiometry, to objective evaluations, such as Otoacoustic Emissions (OAE) and the Auditory Brainstem Responses (ABRs) (Norton et al., 2000; Núñez Batalla et al., 2020; Widen et al., 2005). These examinations must meet methodological criteria that support precise diagnosis and facilitate therapeutic decision making. In this context, it is crucial to answer three key questions: Does the recorded neurophysiological component really measure what it is intended to measure? Are the recordings consistent and reproducible in different moments and conditions? And, lastly, is the examination able to detect clinically meaningful changes or relevant differences between individuals or groups?
ABRs allow for obtaining objective responses associated with auditory sensitivity. The neurophysiological response allows for evaluating the functionality of the auditory pathways, from the cochlea and the auditory vestibular nerve to the brainstem (Barajas de Prat et al., 2007; Barajas, 1985; Delgado Hernández et al., 2003). The low amplitude of the physiological signal, as well as the presence of artifacts, has a direct influence on the quality of the recordings. The state of alertness of the patient, muscular movements or electric perturbations may cause variations in the results, affecting its precision. To improve its reliability, procedures like filtering the signal and averaging are applied. The latter, introduced by Dawson (1954), consists of the combination of the obtained responses after the repeated presentation of stimuli, thus minimizing the random interferences of the electroencephalographic activity in the background. The filtering of the signal deletes undesired frequencies through the application of high-pass or low-pass filters, restricting the recording to a specific range of frequencies (Doyle & Hyde, 1981). The setup of this parameter is established according to the component or the neurobiological activity to be analyzed. For example, in the frequency spectrum, ABRs are found mostly between 500 Hz and 1500 Hz. For this reason, a band-pass filter is commonly applied in the 30Hz to 100Hz range for the high-pass one, and another one from 1500 Hz to 3000 Hz for the low-pass one (Elberling, 1979). This filtering accomplishes two fundamental objectives: on the one hand, removing low-frequency noise, which is caused by physiological artifacts, such as muscular activity (myogenic noise); and, on the other hand, reducing high-frequency noise, which generally includes electric interferences and environmental noise.
Validity refers to the capacity to estimate the auditory sensitivity based on the electrophysiological responses. This concept is grounded in two fundamental indicators: sensitivity and specificity. The sensitivity shows the test’s capacity to correctly identify the positive cases, that is, the subjects with hearing loss. In turn, the specificity measures the capacity to detect negative cases, distinguishing the subjects with normal hearing.
This study analyzes the precision and reliability of ABRs, considering criteria like reliability, validity, sensitivity and specificity. The methodological foundations that guarantee a precise evolution and reproducible analysis are examined; these include strategies for the minimization of artifacts and the improvement of signal to noise ratio. Additionally, the impact of these procedures is emphasized in the optimization of the auditory diagnosis, allowing for a better identification of hearing loss and facilitating evidence-based clinical decision making.
Measure’s reliability: Averaging Techniques
The components identified in the electrophysiological recording can be referred to as observed scores, which are composed by two main elements: the true score, which represents the physiological response to a stimulus, and the associated error, which corresponds to the background noise of the EEG (electroencephalogram). Reliability is defined as the observed variability’s proportion attributable to the true score. In the case of ABRs, the reproducibility of the recordings is a key factor for reliability, since the tests can be obtained in variable conditions. This quotient allows for determining the extent to which the results are free of errors and reflects the measure’s accuracy. The following equation establishes the reliability in relation to the variance:
Where:
R: Reliability (value between 0 and 1).
: Variance of the True Score (desired component of the measure).
: Total Observed Variance, which includes both the true variance and the error variance.
Additionally, the total observed variance is divided as follows:
Where:
: Error Variance.
The equation establishes that the reliability (R) directly depends on the relation between the true variance () and the error (). When is low, reliability approaches its maximum value (R≈1). This happens because, in these conditions, almost all observed variance is attributed to differences in the measured characteristics and not to random fluctuations or measurement mistakes. In other words, this implies that the recordings’ results are consistent, steady and that they primarily reflect the response to the presented stimuli. On the contrary, when the error’s variance is big in relation to the true variance >> , the reliability decreases. In this case, the measures are so influenced by random or external factors that it becomes impossible to distinguish the signal from the background noise.
One of the most effective strategies to improve the reliability of the recording is increasing the numbers of averages. Each additional sweep progressively reduces the noise’s impact, favoring the signals detection. This relation is described through the following equation, described by Hall (2007, p. 95):
The signal-to-noise ratio (SNR) improves when increasing the signal’s amplitude, decreasing the noise, or raising the number of averages, with a gain proportional to the square root of the latter. However, this improvement has decreasing returns, which becomes especially relevant in small children, where recording time is limited (Cone & Norrix, 2015). Figure 1 illustrates this relation, showing how the SNR varies depending on the number of sweeps and the stimulation level. The Standard Deviation Ratio (SDR) is calculated by dividing the standard deviation of the recordings’ average (response + noise) by that of the residual noise. The first one shows the observed variance; the second one, the error. A high SDR denotes a higher ratio of response compared to noise. This measurement, together with the Correlation Coefficient between Replicates (CCR), was chosen for its clinic applicability, operative easiness and literature backing (Hall, 2007; Picton et al., 1983).
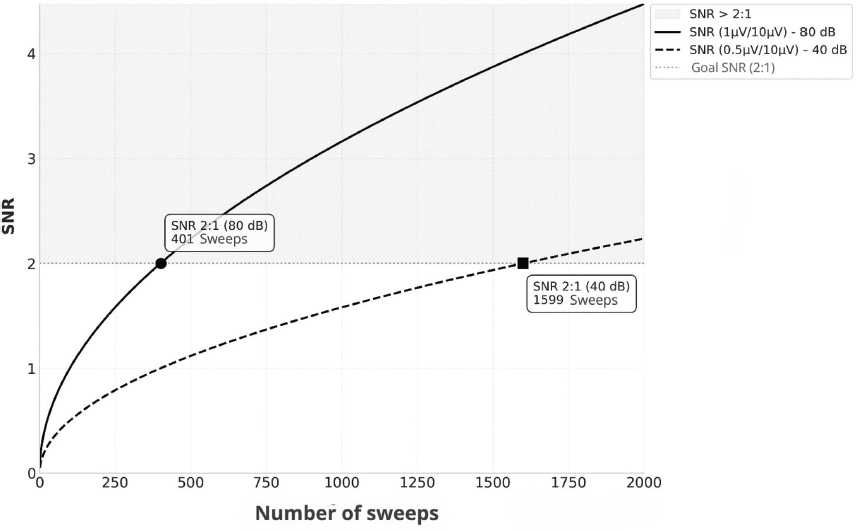
Figure 1. Example of the change in SNR with the number of sweeps in a recording obtained in a patient with a hearing loss of 40 dB HL, the amplitude of the wave V at 80 dB nHL is 1 µV, with a background EEG of 10 µV. To accomplish an SNR of 2:1, approximately 401 averagings (solid line) are required. However, at 40 dB nHL, the amplitude of the wave V decreases to 0.5 µV, which increases the averagings to reach the same SNR to 1600 (dashed line).
Standard Deviation Ratio
The Standard Deviation Ratio (SDR) is a parameter used in the evaluation of recording’s quality (Madsen et al., 2018; Picton et al., 1983). Although it doesn’t directly equate to the classic coefficient of reliability, SDR allows for estimating the extent to which the evoked response is visible above the background noise, facilitating a safer interpretation of the neurophysiological activity. SDR is calculated as the square root of the quotient divided by the variance of the recording’s average (which includes both the response and the background noise) and the variance of the residual noise:
Where:
: Variance of the recording’s average.
: Variance of the residual noise, estimated through the subtraction between two replicates of the same stimulus.
The noise floor is calculated through a cross-correlation procedure, which consists of subtracting one replicate from another of the same presentation (Schimmel, 1967; Wong & Bickford, 1980). This subtraction removes the coordinated response, only leaving the random component. Even though the SDR doesn’t directly represent the signal to noise ratio in decibels like the SNR, it does act like a useful relative metric for the quantification of the recording’s clarity. For practicality reasons, standard deviations have been used instead of variances, since they are directly related to the amplitudes of the evoked components.
Coefficient of Correlation between Replicates
The Coefficient of Correlation between Replicates (CCR) measures the reliability or consistency of the evoked responses averaged based on two replicates (Picton et al., 1983; Wang et al., 2021). Mathematically, it is expressed as:
Where:
: Values of the first replicate.
: Values of the second replicate.
: Averages of each replicate.
A high CCR denotes a good consistency between replicates, which suggests that the averaged signal is barely affected by the noise. Values of CCR > 0.5 are considered acceptable, while values over 0.7 suggest a high level of reproducibility (Berninger et al., 2014). Low values of SDR or CCR suggest that the recording is dominated by the noise, which can be due to technical factors, such as bad electrode placement or excessive background noise. It can also arise from patient’s conditions, like ocular movement. In these cases, it is advised to repeat the recording trying to improve the test’s conditions. The CCR is strongly related with the SNR. This relation is mathematically expressed as:
Where:
CCR: Coefficient of Correlation between Replicates.
SNR: Signal/Noise Relation.
This equation establishes that the CCR not only measures the consistency between replicates, but also acts as a direct indicator of the preponderance of the signal over the noise. While the CCR gets closer to 1, the SNR increases in a non-linear way, which reflects a signal that becomes progressively more dominant compared to the noise. In Figure 2 we can observe that a CCR of 0.7 results in an SNR of 2.3 dB, while a CCR of 0.95 increases the SNR to 19 dB, showing an exponential growth. Conversely, low values of CCR, close to 0, imply a dominance of the noise over the signal, which limits the interpretation of the recording.
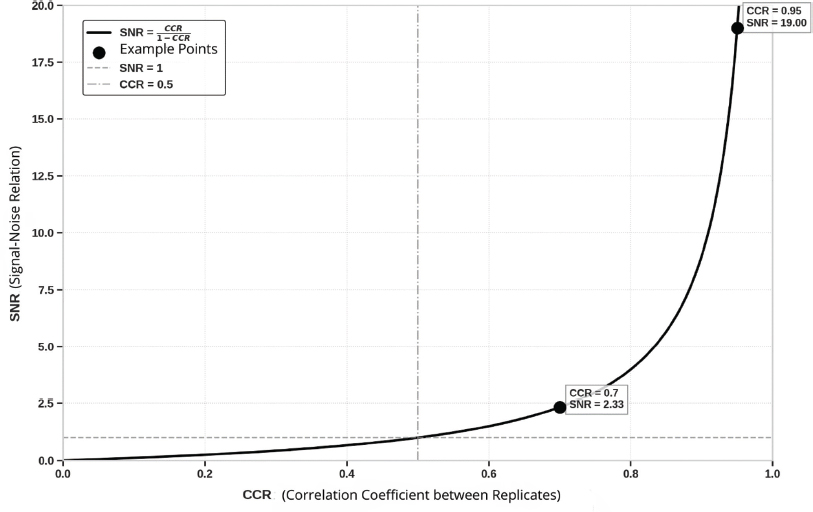
Figure 2. Relation between CCR and SNR. The chart shows how the SNR increases exponentially while the CCR gets closer to 1. For example, a CCR = 0.7 corresponds to an SNR = 2.33 dB, while a CCR = 0.95 increases the SNR up to 19 dB. The reference lines indicate SNR = 1 dB, when signal and noise are equivalent, and CCR = 0.5, medium value of consistency.
The joint interpretation of the SDR and the CCR is essential for identifying recordings that require a careful analysis and, in necessary cases, its repetition. A high SDR together with a low CCR suggests that, even though the average signal is high compared to the noise, the replicas have not been consistent. This may be due to the presence of artifacts or bad recording conditions, which compromise the reliability of the results.
The ideal combination is a high SDR with a high CCR, which reflects a strong recording, where the signal is clearly distinguishable from the noise and remains consistent through the replicas. However, a high CCR with a low SDR doesn’t necessarily imply a bad recording, instead, it can simply show that the response is of low-amplitude but reliable. In these cases, even if the signal is weak in comparison to the noise, its consistency between replicas suggest that the measure is valid.
Weighted Average
In the classical averaging techniques, it is assumed that the noise present in the recording is stable, which means that its statistical attributes, such as the mean and the variance, remain constant over time (Mühler & von Specht, 1997). However, this assumption hardly ever meets real recordings. In clinical environments, factors such as patient’s movements, blinking, background noise or variations in the electrodes’ placement cause a non-stationary noise that varies in intensity and characteristics through the recording. The classic averaging doesn’t account for these temporal variations, which affects the recording’s quality when including the averaging sweeps contaminated by noise that distort the final result. To address this limitation, techniques like weighted averaging have been developed. These assume a non- stationary model of noise (Hoke et al., 1984; McKearney et al., 2023). This approach divides the recording in discrete subsets, named blocks, allowing the identification and exclusion of specific sections affected by peaks of excessive noise.
In this model, every recording is represented as the sum of the fixed signal s(t) and a component of non-stationary noise ci(t), which in turn is the product of a stationary noise ηi(t) and a multiplicative factor ci(t) that varies slowly:
Where:
is the average recording.
the signal of interest.
is a factor that modulates the noise’s amplitude.
is a stationary noise with measure 0 and unitary variance.
In weighted averaging techniques, specific statistics are used, such as the variance of the residual noise and the average power of the signal, to optimize the SNR (Davila & Mobin, 1992; Kumaragamage et al., 2016). The variance of the residual noise measures the spreading of the noise’s amplitudes inside of every data block, identifying the sections with more artifact contamination or background noise. On the other hand, the average signal power evaluates the relative intensity of the physiological response to the stimuli inside each block. The procedure begins with the division of data in discrete blocks and the estimation of these parameters in each one. Next, the blocks get weights ascribed, in a way that those with less variance of noise and more power of signal have a bigger influence in the final average.
The block analysis facilitates the usage of statistical tools that allow for automatically detecting the response. This allows reducing the number of needed averages to obtain a reliable recording, because it can stop before the established when meeting a pre-established value of SNR. This optimizes the required time for the tests and minimizes the patient’s burden, especially with pediatric or difficult to evaluate patients. For example, with newborns, the averaging techniques may avoid the use of sedatives (Cone & Norrix, 2015), as schematically represented in Figure 3, where the recording’s segmentation process, the weigh assignation and the differential contribution of the blocks according to the noise level are shown.
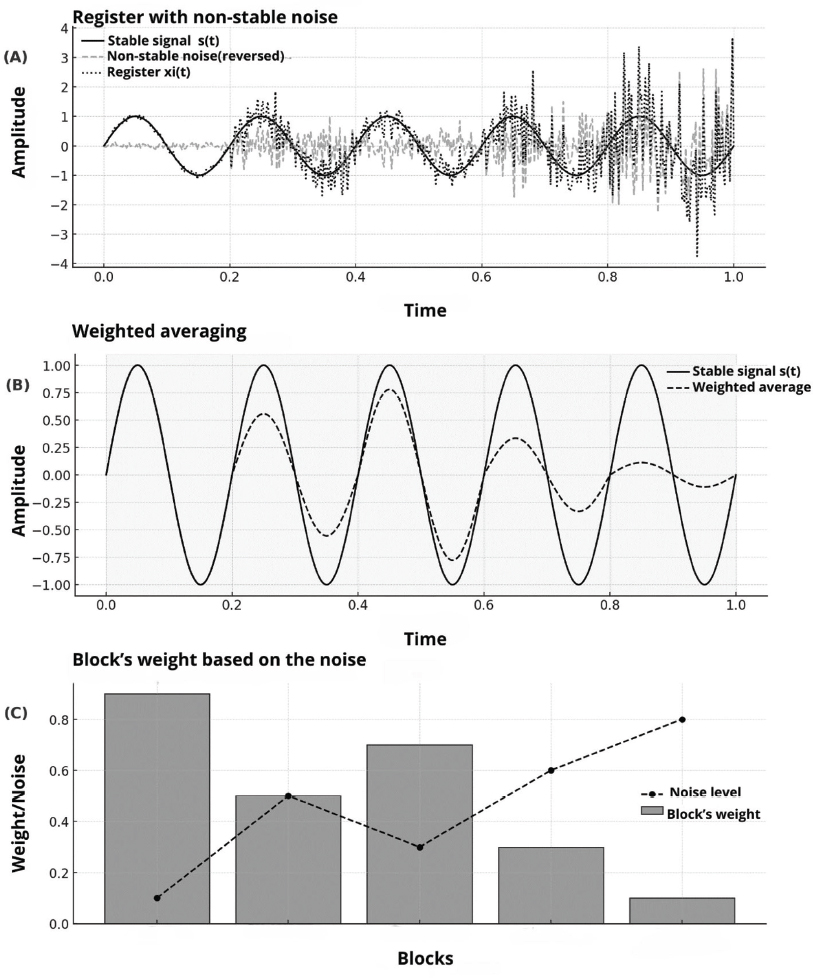
Figure 3. Schematic representation of the weighted averaging principle, based on a temporal simulation of a fictional response. (A) Faint recording with non-stationary noise contamination, in which a fixed signal s(t) is affected by a noise component xi(t) of variable intensity. (B) Implementation of the weighted averaging technique, in which the recording is divided into blocks and averaging coefficients are assigned based on the SNR of each section. The blocks with less interference and more coherence with the interest signal contribute in a more significant way to the final average. (C) Distribution of the assigned weights to the blocks based on the noise level, showing the optimization strategy for the relative contribution of every section in the estimation process of the underlying signal.
Convergent validity: Estimating the pure-tone audiogram
In the diagnostic field, ABRs are a fundamental tool to evaluate the functionality of the auditory pathways and detect structural alterations, such as injuries in the auditory nerve or the brainstem (Barajas, 1985). Additionally, these recordings allow for estimating auditory thresholds in populations where the conventional audiometry is not feasible, like in newborns or patients with limited cooperation capacity (Barajas et al., 1981).
In both situations, the validity concept acquires a great clinical importance. In the first case, it is essential to determine the capacity of ABR to contribute to the diagnosis of pathologies like auditory neuropathy (Starr & Rance, 2015), cerebellopontine angle tumors, such as meningeal tumors (Barajas de Prat et al., 2007), or delay in the nerve conduction associated with the demyelination in multiple sclerosis (Barajas, 1982). In the second case, particularly in the programs of universal neonatal auditory screening, the validity refers to the degree in which the obtained results correlate with the auditory sensitivity evaluated through behavioral methods (Widen et al., 2000).
There are different approaches to establish criteria validity between these tests, including analytic procedures like the threshold subtraction and the regression models, as well as diagnostic indicators such as sensitivity and specificity.
Method of difference between thresholds
This biological calibration method uses subjects with normal hearing as a control group to establish the relation between electrophysiological and perceptual responses. For this, the auditory thresholds are recorded with the same stimuli used in the electrophysiological evaluation, such as clicks or pure tones by impulses. Based on this data, the reference level of 0 dB nHL is defined, equivalent to the average of the measured thresholds in subjects with normal hearing (Bagatto et al., 2010; Gorga et al., 2006; Vander Werff et al., 2009). For example, if the average behavioral threshold for the stimuli of the ABR in a normal hearing group is between 30 dB nHL and 500 Hz, this value is established as reference and is considered equal to 0 dB nHL. If the minimum observable electrophysiological response for this frequency is 25 dB nHL (5 dB below the 30 dB nHL criteria), a correction of -5 dB is applied to adjust the estimation, aligning the electrophysiological results with the behavioral ones. Diverse studies have quantified these correction factors for different frequencies, as summarized in Table 1.
Table 1. The values represent the correction factors applicable to the physiological results of the ABR to estimate the auditory thresholds of the tonal audiometry in normal hearing people, expressed in dB nHL. Average differences were calculated by the subtraction method. The data corresponds to adults, except for the values that Bagatto proposes, obtained from pediatric population.
Study |
500 Hz |
1000 Hz |
2000 Hz |
4000 HZ |
9,8 |
9,4 |
5,3 |
8,3 |
|
20,4 |
-- |
13,4 |
11,8 |
|
20,5 |
-- |
10,0 |
9,6 |
|
15 |
10 |
5 |
0 |
This method stands out due to its simplicity and ease of implementation in clinical settings, since it is based on constant references, eliminating the necessity of complex analysis. Additionally, its application is widely generalizable, allowing the use of uniform reference values for every patient, as long as the same configuration of stimuli and calibration are maintained.
However, this approach has limitations. Reliance on a group of normal hearing people assumes a constant relationship between the electrophysiological and behavioral thresholds, which does not apply to individuals with hearing loss. Furthermore, with severe or profound hearing loss, the lack of neural synchronization and the reduction of amplitude in the response may affect the estimation’s precision, increasing the prediction’s error margin (Chalak et al., 2013; Gorga et al., 2006; McCreery et al., 2015).
Regression models for the threshold estimation
This approach uses linear regression models to estimate the relationship between the electrophysiological and behavioral thresholds, allowing for the adjustment of the systematic differences between the two of them (Gorga et al., 2006; McCreery et al., 2015). Instead of assuming a steady correspondence, the model identifies variation patterns based on the frequency and the degree of hearing loss, which facilitates the application of specific correction factors.
The model is designed to identify and quantify these differences through a mathematical representation that links them with the measures obtained in the ABRs. The linear regression is adjusted according to the data through specific equations that reflect how the differences change based on the observed electrophysiological threshold. Thus, a correction more precise than those obtained with methods that apply constant factors is achieved. The equation used for this model is the following:
Where:
: is the predicted behavioral threshold, obtained after the application of the correction.
: is the observed physiological threshold, which serves as an initial reference point.
x: is the value of the observed physiological threshold in the mx + b term, which influences the predicted differences.
m: is the slope, which reflects how the threshold differences vary based on the physiological threshold (x).
b: is the intersection, which describes the average difference between thresholds when x=0.
This equation models the systematic discrepancies between thresholds, allowing for the calculation of the behavioral threshold as the sum of the observed physiological threshold and the predicted correction (mx + b). This approach is especially useful in the prescription of hearing aids and the early diagnosis of significant hearing loss, because the adaptive corrections help avoiding critical mistakes in the estimations. However, its prescription can be limited with profound hearing loss, where the response is weaker and more difficult to model. Additionally, with newborns and little children, additional adjustments can be needed to improve the prediction. In this context, to obtain real ear measurements through probe tube, and in particular the measurement of the real ear to coupler difference (Real Ear to Coupler Difference, RECD), it is fundamental to reduce the inter and intraindividual variability in the audiometric recordings within these ages and improve the estimations’ precision (Bagatto et al., 2005; Zenker Castro, 2011). Table 2 summarizes the regression models proposed by McCreery et al. (2015), as well as the correction factors derived based on frequency and physiological threshold level.
Table 2. Models of the differences between physiological and behavioral thresholds, estimated based on linear regression equations proposed by McCreery et al. (2015). The correction factors are presented with frequencies associated with the physiological threshold’s level.
Frequency (Hz) |
Regression equation |
Correction factors |
500 |
Y = −0.22x + 5.90 |
20 dB: 5, 40 dB: -3, 60 dB: -7, 80 dB: -12 |
1000 |
Y = −0.13x + 8.32 |
20 dB: 5, 40 dB: 3, 60 dB: 0, 80 dB: -2 |
2000 |
Y = −0.14x + 7.31 |
20 dB: 5, 40 dB: 2, 60 dB: -1, 80 dB: -4 |
4000 |
Y = −0.16x + 9.32 |
20 dB: 6, 40 dB: 3, 60 dB: 0, 80 dB: -3 |
An important aspect of this approach is its capacity to adjust to the patient’s degree of hearing loss. Studies such as those from McCreery et al. (2015) and Gorga et al. (2006) have demonstrated that the differences between the electrophysiological and behavioral thresholds are not linear, especially in cases with significant hearing loss. For example, it was observed that the physiological thresholds tend to underestimate the behavioral thresholds in patients with severe hearing loss, which emphasizes the need for the application of dynamic corrections.
Criterion validity. Sensitivity and specificity
Criterion validity is an indicator that the diagnostic tests used is able to identify both the presence and the absence of hearing loss. This indicator becomes significantly relevant in clinical settings, such as neonatal screening, where an early detection is essential to avoid negative repercussions in language and communication development.
The sensitivity measures a test’s capacity to correctly identify individuals with hearing loss (real positives). This indicator is estimated through the following equation:
Where:
RP (Real Positives). Individuals with hearing loss that have been correctly identified by the test.
FN (False Negatives). Individuals with hearing loss that have not been detected by the test.
A high sensitivity minimizes the occurrence of false negatives, which is crucial in neonatal screening. For example, if an ABR protocol has a sensitivity of 95%, it means that 95% of the patients with hearing loss will be correctly identified, while the remaining 5% could be mistakenly classified as normal hearing individuals.
Specificity evaluates a test’s capacity to correctly identify individuals with normal hearing (true negatives). A high specificity establishes that few people without hearing loss are mistakenly classified as individuals suffering from hearing loss. This indicator is estimated through the equation:
Where:
TN (True Negatives). Individuals with normal hearing that were correctly identified by the test.
FP (False Positives). Individuals with normal audition that were mistakenly diagnosed with hearing loss.
Zenker et al. (2013) analyzed the degree of agreement between three institutions that issued hearing loss diagnoses based on ABR. The results showed a low correlation in the classification of the cases between the different institutions, with an intraclass correlation coefficient (ρ = 0.37), as shown in Figure 4. This value indicates a low concordance between the evaluators, which suggests high diagnostic variability. In clinical terms, this means that ABR’s interpretation was not consistent across institutions, which could lead to differences in the identification of hearing loss depending on where the test is performed. In this study, low agreement was associated with a lack of concurrent validation between electrophysiological and behavioral tests, which resulted in a high rate of diagnostic errors.
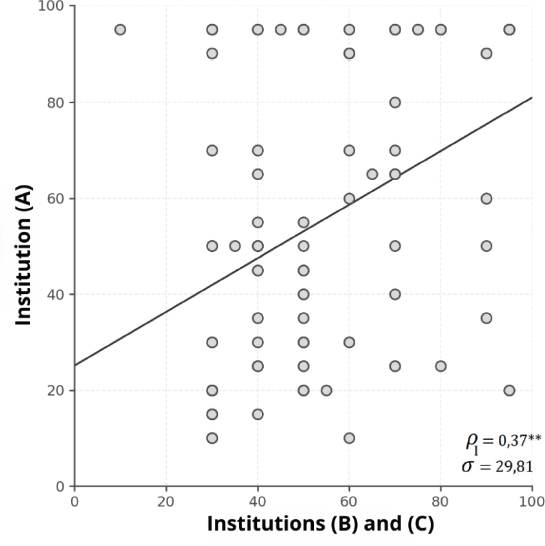
Figure 4. Graphic representation of the intraclass correlation coefficient (ICC) in the hearing loss diagnosis based on ABRs of three institutions. A high variability can be observed between the diagnoses of the evaluated institutions (σ = 29.81), showing a low concordance (ρ = 0.37), which suggests that the diagnosis significantly depends on the institution that evaluates the patient (Zenker et al., 2013).
Discussion
The evaluation of the reliability and validity of ABR recordings allows for assessing its precision and confirming its utility in clinical diagnosis. In this study, we have analyzed how different factors influence the quality of the recordings, including the SNR, the reproducibility of the measures and the precision in the auditory thresholds’ estimation based on neurophysiological responses. The acquisition of these parameters allows for optimizing the methodology of acquisition and interpretation of ABR, minimizing the variability and improving its precision as a diagnostic tool.
This review proposes the use of standard statistical criteria, SDR and CCR, to evaluate the reliability of the recordings. High values indicate stable and reproducible recordings, while discrepancies between the two may reflect the presence of artifacts or non-stationary noise. These indicators, available in the majority of commercial teams, allow for a more objective evaluation of the recording’s quality and contribute to a more accurate interpretation.
Since reliability is a prerequisite for validity, the implementation of statistical criteria that evaluate the plots’ results not only improves consistency, but also strengthens diagnostic capacity. When minimizing intra and interobserver variability, these indicators allow for the auditory thresholds’ estimation based on neurophysiological responses to be more precise and reproducible. This is especially relevant in clinical environments where the subjective interpretation still plays a key role because the combination of these parameters with predictive models based on linear or logistic regression improves the objectivity of ABR, reducing the dependence on experience and increasing its validity.
The optimization of the recording procedure is a key aspect in improving reliability. It has been demonstrated that weighted averaging techniques are more effective than traditional methods because they consider the non-stationary nature of noise and ascribe more weight to the sections with better SNR. This approach not only improves the response detectability, but also reduces the total time required for the recording without compromising the diagnosis’ precision. In pediatric clinical environments, this time reduction is especially relevant because it allows for obtaining better recordings, making it easier to perform the study in less cooperative population.
From a clinical perspective, the criterion validity of ABRs is an essential factor for their application in hearing loss diagnosis. The sensitivity and specificity of these recordings depend on the precision with which they can estimate auditory thresholds in comparison to behavioral tonal audiometry. In this study, the use of linear regression models and the method of threshold difference were analyzed, concluding that this allows for adjusting the estimations based on electrophysiological responses and minimizing systematic errors.
Lastly, even though this study has identified multiple strategies to improve the reliability and validity of ABR, there are some limitations that must be taken into consideration. The interlaboratory variability in equipment arrangement and in the recording parameters may affect the comparison of results. Additionally, ABR interpretation mostly depends on the examiner’s experience, which emphasizes the need for developing standardized protocols that include objective statistical criteria. Future research should focus on the incorporation of modern technologies, such as AI and advanced signal processing, to improve the recording quality and provide objective tools that complement clinical interpretation, thus improving the diagnosis precision.
Conclusions
The incorporation of objective quality indicators in ABR interpretation is key for its clinical use. Reliability and validity are two of the most important indicators, since they ensure reproducible recordings and precise measurements of the auditory thresholds. Reliability, evaluated through SDR and CCR, allows for identifying stable recordings and minimizing variability, while validity ensures that the estimated thresholds accurately reflect the auditory situation of the patient.
Beyond the application of standardized protocols, the use of quantitative criteria improves the clinical interpretation when reducing artifact influence and the examiner’s subjectivity. Furthermore, their implementation contributes to the decrease of interlaboratory variability, facilitating comparability of results between different institutions and optimizing the reliability of ABR as a diagnostic tool. The integration of these indicators in clinical practice improves the diagnosis of hearing loss and facilitates decision making, especially with populations in which these recordings are the only evidence of auditory sensitivity.
References
Bagatto, M., Moodie, S., Scollie, S., Seewald, R., Moodie, S., Pumford, J., & Liu, K. P. R. (2005). Clinical Protocols for Hearing Instrument Fitting in the Desired Sensation Level Method. Trends in Amplification, 9(4), 199–226. https://doi.org/10.1177/108471380500900404
Bagatto, M., Scollie, S. D., Hyde, M., & Seewald, R. (2010). Protocol for the provision of amplification within the Ontario Infant hearing program. International Journal of Audiology, 49(SUPPL. 1), 70–80. https://doi.org/10.3109/14992020903080751
Barajas, J. J. (1982). Evaluation of ipsilateral and contralateral brainstem auditory evoked potentials in multiple sclerosis patients. Journal of the Neurological Sciences, 54(1), 69–78. https://doi.org/10.1016/0022-510X(82)90219-2
Barajas, J. J. (1985). Brainstem Response Audiometry as Subjective and Objective Test for Neurological Diagnosis. Scandinavian Audiology, 14(1), 57–62. https://doi.org/10.3109/01050398509045923
Barajas, J. J., Olaizola, F., Tapia, M. C., Alarcon, J. L., & Alaminos, D. (1981). Audiometric Study of the Neonate: Impedance Audiometry. Behavioural Responses and Brain Stem Audiometry. International Journal of Audiology, 20(1), 41–52. https://doi.org/10.3109/00206098109072681
Barajas de Prat, J., Zenker Castro, F., & Fernández Belda, R. (2007). Potenciales Evocados Auditivos. In C. Suárez & L. M. Gil Carcedo (Eds.), Tratado de Otorrinolaringología y Patología de Cabeza y Cuello (Vol. 6, Issue 5, pp. 1133 – 1155). Editorial Médica Panamericana, S.A.
Berninger, E., Olofsson, Å., & Leijon, A. (2014). Analysis of click-evoked auditory brainstem responses using time domain cross-correlations between interleaved responses. Ear and Hearing, 35(3), 318–329. https://doi.org/10.1097/01.aud.0000441035.40169.f2
Chalak, S., Kale, A., Deshpande, V. K., & Biswas, D. A. (2013). Establishment of normative data for monaural recordings of auditory brainstem response and its application in screening patients with hearing loss: A cohort study. Journal of Clinical and Diagnostic Research, 7(12), 2677–2679. https://doi.org/10.7860/JCDR/2013/6768.3730
Cone, B., & Norrix, L. W. (2015). Measuring the advantage of kalman-weighted averaging for auditory brainstem response hearing evaluation in infants. American Journal of Audiology, 24(2), 153–168. https://doi.org/10.1044/2015_AJA-14-0021
Davila, C. E., & Mobin, M. S. (1992). Weighted Averaging of Evoked Potentials. IEEE Transactions on Biomedical Engineering, 39(4), 338–345. https://doi.org/10.1109/10.126606
Dawson, G. D. (1954). A summation technique for the detection of small evoked potentials. Electroencephalography and Clinical Neurophysiology, 6(C), 65–84. https://doi.org/10.1016/0013-4694(54)90007-3
Delgado Hernández, J., Zenker Castro, F., & Barajas de Prat, J. J. (2003). Normalización de los Potenciales Evocados Auditivos del Tronco Cerebral I: Resultados en una muestra de adultos normoyentes. Auditio: Revsita Electrónica de Audiología, 2(11), 13–18. https://doi.org/10.51445/sja.auditio.vol2.2003.0020
Doyle, D. J., & Hyde, M. L. (1981). Analogue and digital filtering of auditory brainstem responses. Scandinavian Audiology, 10(2), 81–89. https://doi.org/10.3109/01050398109076166
Elberling, C. (1979). Letter to the editor: Auditory electrophysiology: Spectral analysis of cochlear and brain stem evoked potentials. Scandinavian Audiology, 8(1), 57–64. https://doi.org/10.3109/01050397909076302
Gorga, M. P., Johnson, T. A., Kaminski, J. K., Beauchaine, K. L., Garner, C. A., & Neely, S. T. (2006). Using a combination of click-and toneburst-evoked auditory brainstem response measurements to estimate pure-tone thresholds. Ear Hear, 27(1), 60–74. https://doi.org/10.1097/01.aud.0000194511.14740.9c
Hall, J. W. I. (2007). Improving the Signal-to-Noise Ratio (SNR). In New Handbook of Auditory Evoked Responses (1st ed., pp. 95–96). Pearson Education.
Hoke, M., Ross, B., Wickesberg, R., & Lütkenhöner, B. (1984). Weighted averaging - theory and application to electric response audiometry. Electroencephalography and Clinical Neurophysiology, 57(5), 484–489. https://doi.org/10.1016/0013-4694(84)90078-6
Kumaragamage, C. L., Lithgow, B. J., & Moussavi, Z. K. (2016). Investigation of a new weighted averaging method to improve SNR of electrocochleography recordings. IEEE Transactions on Biomedical Engineering, 63(2), 340–347. https://doi.org/10.1109/TBME.2015.2457412
Madsen, S. M. K., Harte, J. M., Elberling, C., & Dau, T. (2018). Accuracy of averaged auditory brainstem response amplitude and latency estimates. International Journal of Audiology, 57(5), 345–353. https://doi.org/10.1080/14992027.2017.1381770
McCreery, R. W., Kaminski, J., Beauchaine, K., Lenzen, N., Simms, K., & Gorga, M. P. (2015). The Impact of Degree of Hearing Loss on Auditory Brainstem Response Predictions of Behavioral Thresholds. Ear and Hearing, 36(3), 309–319. https://doi.org/10.1097/AUD.0000000000000120
McKearney, R. M., Bell, S. L., Chesnaye, M. A., & Simpson, D. M. (2023). Optimising weighted averaging for auditory brainstem response detection. Biomedical Signal Processing and Control, 83(August 2022), 104676. https://doi.org/10.1016/j.bspc.2023.104676
Mühler, R., & von Specht, H. (1997). Reduction of Background Noise in Human Auditory Brainstem Response by Means of Classified Averaging. In Acoustical Signal Processing in the Central Auditory System (pp. 599–604). Springer US. https://doi.org/10.1007/978-1-4419-8712-9_56
Norton, S. J., Gorga, M. P., Widen, J. E., Folsom, R. C., Sininger, Y., Cone-Wesson, B., Vohr, B. R., Mascher, K., & Fletcher, K. (2000). Identification of Neonatal Hearing Impairment: Evaluation of transient evoked otoacoustic emission, distortion product otoacoustic emission, and auditory brain stem response test performance. Ear and Hearing, 21(5), 508–528. https://doi.org/10.1097/00003446-200010000-00013
Núñez Batalla, F., Jáudenes Casaubón, C., Sequí Canet, J. M., Vivanco Allende, A., Zubicaray Ugarteche, J., & Olleta Lascarro, I. (2020). Actualización de los programas de detección precoz de la sordera infantil: recomendaciones CODEPEH 2019 (Niveles 2, 3 y 4: diagnóstico, tratamiento y seguimiento) | Update in early detection of pediatric hearing loss: 2019 CODEPEH recommendations. Revista Española de Discapacidad, 8(1), 219–246. https://doi.org/10.5569/2340-5104.08.01.13
Picton, T., Linden, R., Hamel, G., & Maru, J. (1983). Aspects of Averaging. Seminars in Hearing, 4(04), 327–340. https://doi.org/10.1055/s-0028-1094195
Purdy, S. C., Houghton, J. M., Keith, W. J., & Greville, K. A. (1989). Frequency-Specific Auditory Brainstem Responses: Effective Masking Levels and Relationship to Behavioural Thresholds in Normal Hearing Adults. International Journal of Audiology, 28(2), 82–91. https://doi.org/10.3109/00206098909081613
Schimmel, H. (1967). The (+) reference: accuracy of estimated mean components in average response studies. Science, 157(784), 92–94. https://doi.org/10.1126/science.157.3784.92
Stapells, D. R. (2000). Threshold Estimation by the Tone-Evoked Auditory Brainstem Response: A Literature Meta-Analysis. Journal of Speech Language Pathology and Audiology, 24(2), 74–83.
Starr, A., & Rance, G. (2015). Auditory neuropathy. In Handbook of Clinical Neurology (1st ed., Vol. 129). Elsevier B.V. https://doi.org/10.1016/B978-0-444-62630-1.00028-7
Vander Werff, K. R., Prieve, B. A., & Georgantas, L. M. (2009). Infant Air and Bone Conduction Tone Burst Auditory Brain Stem Responses for Classification of Hearing Loss and the Relationship to Behavioral Thresholds. Ear & Hearing, 30(3), 350–368. https://doi.org/10.1097/AUD.0b013e31819f3145
Wang, H., Li, B., Lu, Y., Han, K., Sheng, H., Zhou, J., Qi, Y., Wang, X., Huang, Z., Song, L., & Hua, Y. (2021). Real-time threshold determination of auditory brainstem responses by cross-correlation analysis. IScience, 24(11), 103285. https://doi.org/10.1016/j.isci.2021.103285
Widen, J. E., Folsom, R. C., Cone-Wesson, B., Carty, L., Dunnell, J. J., Koebsell, K., Levi, A., Mancl, L., Ohlrich, B., Trouba, S., Gorga, M. P., Sininger, Y. S., Vohr, B. R., & Norton, S. J. (2000). Identification of Neonatal Hearing Impairment: Hearing status at 8 to 12 months corrected age using a visual reinforcement audiometry protocol. Ear and Hearing, 21(5), 471–487. https://doi.org/10.1097/00003446-200010000-00011
Widen, J. E., Johnson, J. L., White, K. R., Gravel, J. S., Vohr, B. R., James, M., Kennalley, T., Maxon, A. B., Spivak, L., Sullivan-Mahoney, M., Weirather, Y., & Meyer, S. (2005). A Multisite Study to Examine the Efficacy of the Otoacoustic Emission/Automated Auditory Brainstem Response Newborn Hearing Screening Protocol. American Journal of Audiology, 14(2), S205–S216. https://doi.org/10.1044/1059-0889(2005/022)
Wong, P. K., & Bickford, R. G. (1980). Brain stem auditory evoked potentials: The use of noise estimate. Electroencephalography and Clinical Neurophysiology, 50(1–2), 25–34. https://doi.org/10.1016/0013-4694(80)90320-x
Zenker Castro, F. (2011). Controversias en el diagnóstico y adaptación audioprotésica en pérdidas auditivas severas en niños. Audiol Hoy, 8(1), 65–71.
Zenker Castro, F., Estrada Alonso, M. M., Larumbe Zabala, E., & Barajas De Prat, J. J. (2013). Fiabilidad diagnóstica de los potenciales evocados auditivos del tronco cerebral en una muestra de pacientes en edad infantil. Actas Del IX Congreso de La Asociación Española de Audiología, 153–159.
Conflict of interest
The authors declare no conflict of interest.
Author contributions
FZ: conceptualization, writing - original draft, writing - review & editing, supervision and visualization. JJB: conceptualization, writing - review & editing.
Funding
This investigation has not received any external funding.
Acknowledgements
This article is dedicated to the memory of Mr. Manuel Expósito, a reference professional in the use of Auditory Brainstem Response at the Barajas Clinic. He trained the first author in this technique and was responsible for conducting the recordings of the first neonatal auditory screening program in Spain, carried out in 1988 in Santa Cruz de Tenerife.
Statement on the use of AI
During the preparation of this manuscript, ChatGPT 4o was used to improve the clarity and precision of the language and to refine the imagery. The authors then revised and edited the content, assuming full responsibility for the final version.
Editorial Office
Translation: Xóan Blanco López and Noelia Corzo Crespo
Production: Glaux Publicaciones Académicas